
In my last article I had explained what is a stock Index ? How it is constructed ? and Why it goes Up or Down?, the objective of writing that article was to explain construction and functioning of stock indices and also to explain that over a long run, stock indices can grow to any levels depending upon growth of economy and profitability of the companies in that indices. Normally a layman investor doesn’t understand all these fundamental factors and lives with a myth that stock indices like Sensex was at peak in 2008(21k+) and it crashed from that level and write now it is at 26K+ levels so markets are at peak and have become very risky. But they are not able understand relationship between growth in Earnings Per share and indices. Here in this article, I will try to explain about relationship between growth in Earnings Per Share and Equity Indices, with history of Sensex and its Price to Earnings Ratio and how to take your investment decisions based on PE Ratio.
For better understanding of this article I would always recommend you to read two of my earlier articles, one was on “What is Equity? and Why share prices move up or down?” and another was on “ What is a stock Index? , How it is constructed ?and why it moves up or down?”.
Let us first understand what is Earnings Per Share to understand Price to Earnings Ratio.
Earnings Per Share (EPS): First understand this by a simple example. For instance, there is a company which has issued 100 shares and has earned net profit of Rs. 1000. In this case Earning per share would be Rs. 10 (Earning per share= Net Profit/no. of shares issued)
Similarly Sensex is an index of 30 large companies of India. Earning per share of Sensex is arrived at by dividing the net profit of these 30 companies by total no. shares of these 30 companies combined together. Nifty is an Index of 50 large companies of India and EPS of Nifty is arrived at by dividing the net profit of 50 companies by total no. of shares of these 50 companies combined together.
Price to Earnings Ratio: Price to Earnings Ratio is the ratio which reflects relationship between market price of the share and Earning per share of the company.It is arrived at through following formula.
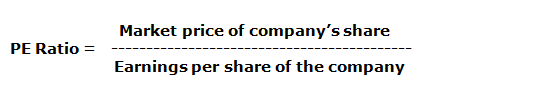
Price to Earnings Ratio is an indicator of valuation of the company. It gives you an idea whether company is available at cheaper valuations or costly valuations. Let me explain with an illustration.
There are two companies Company A and company B. Both are in the same industry and following is the chart of their data.
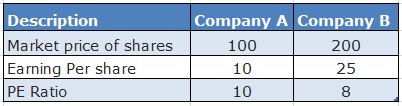
Looking at above table, at first instance it looks like company A is cheaper because its share is available at Rs. 100. And company B’s share is available at Rs. 200 so a layman investor would jump up and buy the Shares of company A considering that he is buying a cheaper company. But look at EPS, company B’s EPS is Rs. 25 whereas company A’s EPS is Rs. 10 only so PE Ratio of company B is 8 times and it is lower than company A which is 10 times . This indicates that your return on investment is 12.5% (25/200= 12.5%) for company B and for company A it is 10% (10/100= 10%) so if other factors are same which company’s share would you like to buy now? company A which is expected to give you 10% return on your investment or company B which is expected to give you 12.5% return on your investment.
You can also look at PE Ratio like this, if you are buying company A with Rs. 10 EPS at Rs. 100 per share, this means you are paying price which is 10 years of profit of company A and if you are buying a company B with Rs. 25 EPS at Rs. 200 per share, you are paying price which is 8 years of profit of company B so which one you should buy now?
Lower the PE Ratio Better it is: From above discussion one point you should understand clearly is lower the PE Ratio better it is and so you should buy stocks when they are available at lower PE Ratio and you should look at PE Ratio for comparison between two companies of same industry and not the price on standalone basis.
PE Ratio of Sensex and important lessons: while calculating PE Ratio for any index like Sensex we have to take value of Index and divide it by sum total of EPS of all the companies in that Index. Normally PE Ratio of Indices like Sensex and Nifty is given on the website of BSE and NSE respectively.
Why you should look at PE Ratio of Index: Normally a layman investor keeps looking at Index value and tries to judge whether it is cheap or costly. This is a wrong way to judge the things because whether index is cheap or costly should be judged from its Earnings per share. For better understanding look at the table below:
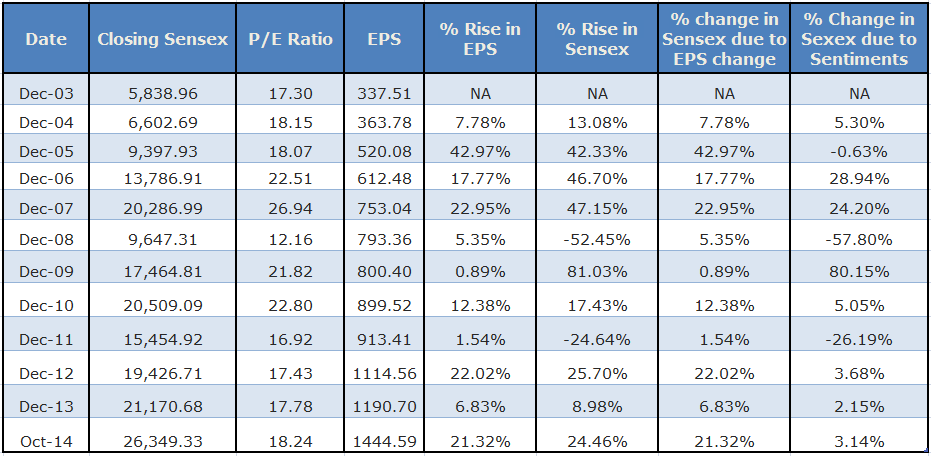
In above table I have taken data of Sensex, its PE Ratio and EPS calendar year wise starting from Dec-2003 to Dec-2013 and at last for Oct-2014. Than column E and column F gives us Rise in EPS and rise in Sensex in percentage terms respectively. After that column G shows percentage change in Sensex due to change in EPS and column H shows percentage change in Sensex due to sentiments.
Fundamentally over a long period of time Sensex or any indices should grow or fall due to change in EPS but over a short term news and sentiments also play important role so in above table you will see in 2006 and 2007 EPS has grown by 17.8% and 23% respectively where as Sensex has grown by 46.7% and 47.1%. So Sensex has grown faster than the EPS which is fundamentally wrong and reflects the positive sentimental impact and as a result you can see that PE Ratio which was at around 18 times in Dec-2005 has gone up and reached to the 26.94 in Dec-2007. This clearly indicates that markets were overvalued in Dec-2007. But sentiments cannot drive the markets for long period of time so in 2008, EPS has slowed down and grown by 5.4% but Sensex has fallen by 52.4% and PE Ratio has fallen to 12.16 times in Dec-2008 and become relatively cheaper. Now retail investors where investing at peak level of 2007 but they did not invest at bottom levels of 2008.
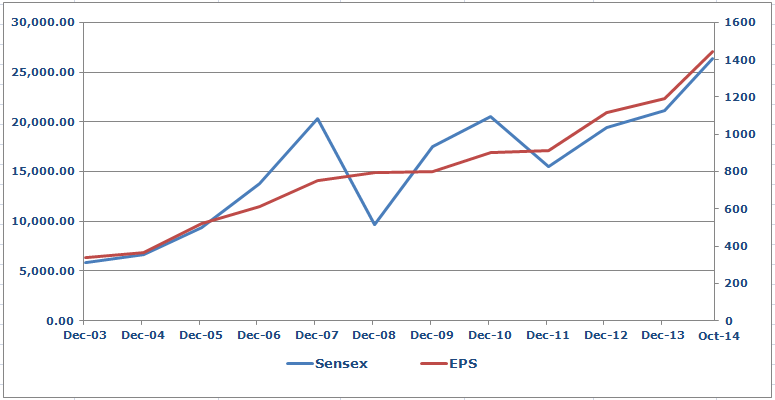
Graph A
Graph B
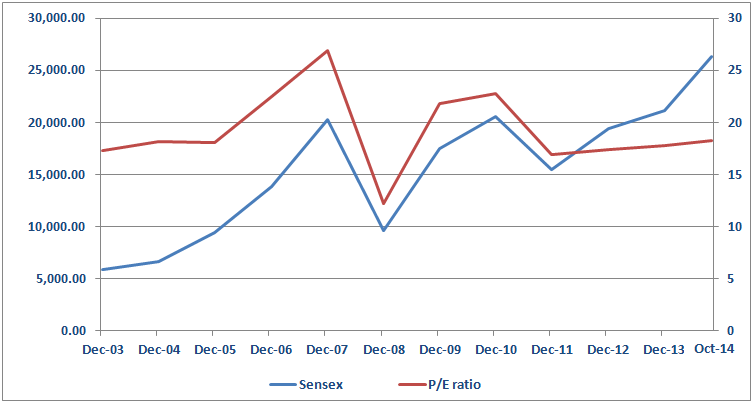
Now look at above two graphs, Graph A reflects relationship of EPS and Sensex from Dec-2003 to Oct-2014. It clearly indicates that EPS has kept on growing slowly without much fluctuation and Sensex has also grown with same pace over the same long term period but has lots of fluctuations and whenever it has gone beyond the speed of EPS, it has fallen in next few years and whenever it has fallen and EPS has grown or remained stable, it has gone up sharply in next few years. Also look at the relationship between Sensex and PE Ratio in graph B, whenever Sensex has grown very fast without corresponding growth of EPS, PE Ratio is very high which reflects markets are very high and prices of individual shares are overvalued. This means people are paying premium on future expectations but after that Sensex has fallen badly and vice versa.
Conclusion : All above analysis brings us to conclusion that over a long term, markets follow growth in EPS and over a short term markets follow sentiments and news because human beings are emotional and react emotionally rather than rationally. One more point that I strongly want to make out is while making your investment decisions you should look at PE Ratio of the indices like Sensex and Nifty and not their absolute values. Following table will give you idea of what you should do at different PE levels.
Important Note: Before you make investments based on following valuations you should consult a qualified financial planner and do your Risk Profiling and asset allocation and only follow this pattern in your long term goals and not in your short term goals which are within 3 to 4 years from now.
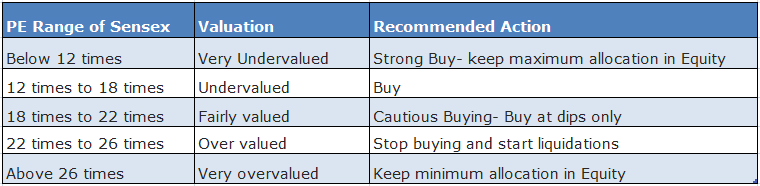
Below 12 Times PE Ratio: Below 12 times PE ratio is highly undervalued and so you should invest as much as you can and increase your equity allocation. The risk reward ratio, when the PE Ratio is below 12 times is very favorable because markets are undervalued. Chances of losing money over long term are almost nil and chances of making extremely good returns are very high.
Between 12 to 18 Times PE Ratio: Average PE Ratio of Sensex is around 18 times. So Between 12 times to 18 times market is undervalued and you can invest in equities. Here also risk reward ratio is favorable and chances of making money are high.
Between 18 times to 22 Times PE Ratio: At this range markets are becoming overvalued and so you should slowly stop investing and at higher levels you should also reduce allocation to equity.
Between 22 to 26 Times PE Ratio: Between this range markets are highly overvalued and you should start selling your equities actively without waiting much. Making fresh investment at this level in equities is can be very risky because risk reward ratio is not favorable.
Above 26 Times: investing at these levels is equivalent to making a suicide attempt. If you invest at this PE Levels, you will see negative returns in short term and for making positive returns you will have to wait very long.
So the message I want to convey is don’t look at index number on standalone basis also look at its PE Ratio because it reflects the relationship between EPS and price and if EPS has grown and Index is growing then it is not a matter of worry but if Index has grown faster than EPS then you should be extremely cautious.