
“As an investor holding investments in Indian markets, if my portfolio has earned an annual return of 14% over the last 10 years, but the INR has depreciated by around 10% in recent years – does that mean my real return is only 4%?”
This is one of the most common and most misunderstood questions we receive, particularly from NRIs and globally aware Indian investors.
Let’s address this question step by step, logically, and most importantly, using the right timeframes.
Where the Confusion Comes From
At first glance, this comparison sounds intuitive. However, financially, it mixes two very different timelines, which can lead to incorrect conclusions. There are two key issues here:
- Comparing long-term portfolio returns with short-term currency movements
- Ignoring the impact of compounding (CAGR) while focusing only on recent currency depreciation
Because of this mismatch, investors often underestimate the true strength of long-term equity returns.
Matching the Time Periods Before Comparing becomes important as we cannot subtract the 10-year investment returns by 2-year currency movement because both of them has different timeframe. Currency movements may impact the final converted value, but they do not erase long-term compounding.
We discussed what was the fault in the perspective but what can be the right frame to see through the same problem?
How you can actually gauge the returns
- NIFTY 500 TRI (INR)
- NIFTY 500 TRI (USD-adjusted)
- S&P 500 TRI (USD)
| Year | NIFTY 500 TRI (INR) | NIFTY 500 TRI (USD) | S&P 500 TRI (USD) |
|---|---|---|---|
| 2016 | 5.12% | 2.42% | 11.96% |
| 2017 | 37.65% | 46.53% | 21.83% |
| 2018 | -2.14% | -10.20% | -4.38% |
| 2019 | 8.97% | 6.25% | 31.49% |
| 2020 | 17.89% | 15.15% | 18.40% |
| 2021 | 31.60% | 29.07% | 28.71% |
| 2022 | 4.25% | -6.13% | -18.11% |
| 2023 | 26.91% | 26.19% | 26.29% |
| 2024 | 16.24% | 13.03% | 25.02% |
| 2025 | 7.76% | 2.48% | 17.88% |
A Practical Illustration
Investment 1: India (NIFTY 500)
Assume:
- USD 100,000 converted on 1 January 2016
- USD/INR = 66
- Amount invested = 766 lakh
- NIFTY 500 index level = 9,603
Value on 1 January 2026:
- Investment value = ₹2.62 crore
- Growth = 3.97x
Investment 2: USA (S&P 500)
Assume:
- USD 100,000 invested directly on 1 January 2016
- S&P 500 index level ≈3,822
Value on 1 January 2026:
- Investment value = USD 398,274
- Growth = 3.98x
-
- USD 290,965, i.e. 2.91× of the original investment
| Particulars | NIFTY 500 TRI (INR) | NIFTY 500 TRI (USD) | S&P500 TRI (USD) |
|---|---|---|---|
| 10 years CAGR return | 14.76% | 11.26% | 14.81% |
This shows that:
- Currency does reduce returns when viewed in USD
- But Indian equities still deliver strong dollar-adjusted performance over long periods
- This comparison is still purely based on Index. Let me show a better and more detailed comparison by comparing Actively managed Mutual Funds and S&P 50О (India being a developing and less saturated market, It is possible to generate Alpha by actively managing the Funds. In US, traditionally Mutual Funds under perform the Index. Thus, comparing Indian Actively Managed Mutual Fund with Index fund of US is apple to apple comparison)
Now let's take this one step further.
What if instead of an index, an investor had invested in actively managed Indian equity mutual funds, and we adjusted their returns for INR depreciation?
We analysed the average of top 3 actively managed funds across four major categories over the last 10 years.
| Particulars | Flexicap Fund | Multicap Fund | Midcap Fund | Smallcap Fund | S&P 500 TRI (USD) |
|---|---|---|---|---|---|
| 10 years CAGR return INR terms | 17.51% | 15.49% | 18.79% | 18.16% | NA |
| Value if INR 66L was invested 10 years ago (Equivalent of 100K USD) | ₹ 3,31,35,399 | ₹ 2,78,60,426 | ₹ 3,69,26,892 | ₹ 3,50,14,567 | NA |
| 10 years CAGR return USD terms | 14.01% | 11.99% | 15.29% | 14.66% | 14.81% |
| Value if USD 100,000 was invested 10 years ago | $ 3,71,047 | $ 3,10,253 | $ 4,14,803 | $ 3,92,685 | $ 3,97,921 |
Well-selected Indian equity Mutual Funds have remained competitive with US markets even after currency adjustment.
So what should be done now?
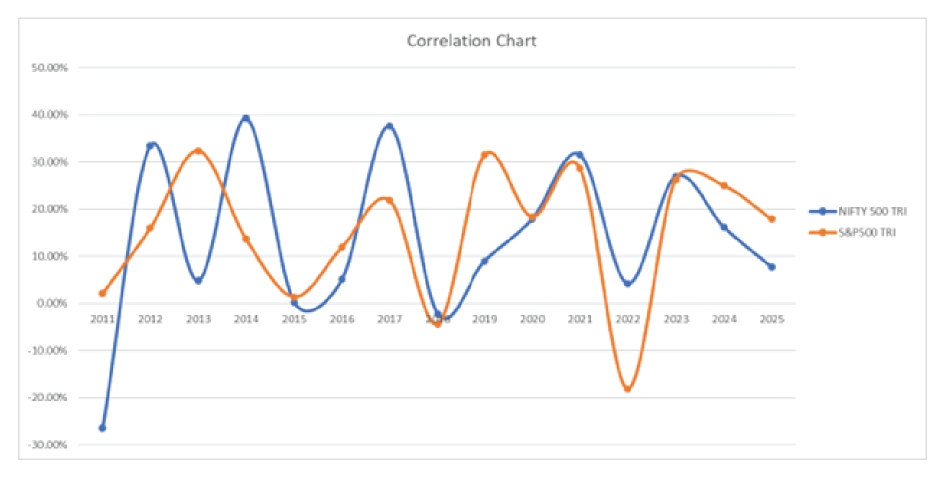
Instead of making your decision just on basis of returns, you should also consider correlation between 2 markets. Correlations range from -ve 1 to +ve 1. If correlation between returns of 2 asset classes or markets is -ve 1, it is perfectly negative which means that returns of both of these markets move in opposite direction and with same momentum. If correlation is +ve 1, it means that returns of both of these markets move in same direction with same momentum. So, if you combine assets with good returns and with low correlation, you can get good returns but with very low volatility.
The correlation between NIFTY 500 TRI and S&P 500 TRI over the last 15 years is ~0.48, indicating a low positive correlation.
This means:
- The two markets do not move in perfect sync
- Combining them improves diversification and stability
The key takeaway is simple:
An investor does not need to choose India or the US.
A well-structured portfolio can — and should – include both.
This approach helps:
- Capture growth from two major economies
- Reduce volatility
- Manage currency and market-cycle risks more effectively
Conclusion
A headline "14% return" is a great start, but without context, it can be misleading — especially when comparing across geographies and currencies.
For NRIs and global investors, the real return lies at the intersection of local equity performance and currency movement. By analysing both Indian and U.S. markets and adjusting appropriately you can build portfolios that harness growth from both economies, reduce concentration risk, and manage currency impacts over time.