One of the most surprising things I notice in investors is how emotions drive decisions. Sometimes, those emotions can work against them.
When markets are rising and excitement is high, many people want to invest more, fearing they might miss out. But when markets decline, fear takes over. They want to pull out their money or hold back, worrying about losing more.
This behavior of jumping in and out can actually increase losses and lower long-term gains. It’s a tough cycle to break because it feels instinctive to react to fear and excitement.
That’s exactly what ValueMetrics’ new analysis shows—and the gaps are far bigger than most people imagine. All figures below are from ValueMetrics Technologies using ACE MF and NSE data as of March 13, 2025; full credit to their research team.
How big is the gap, really?
The research looked at how much a small investment of 10,000 would have grown over 20 years-from April 2005 to March 2025—if an investor stayed fully invested in the market versus missing just a few of the best-performing days.
The results are eye-opening.
1. Nifty 50 TRI
This part of the study tracked 10,000 invested in the Nifty 50 Total Return Index (TRI), which represents India’s 50 largest companies. It shows how staying invested versus missing the best days would have affected long-term growth.
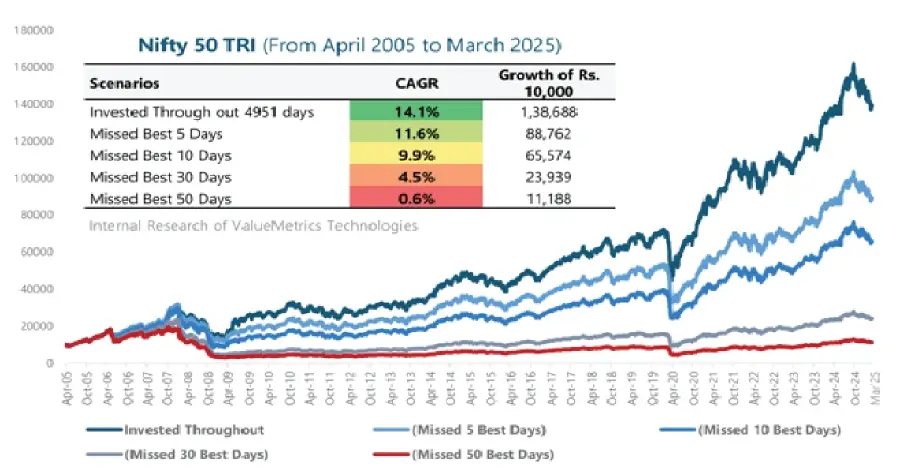
- Fully invested: ₹10,000 + ₹1,38,688 (14.1% CAGR)
- Miss 5 best days: ₹88,762 (11.6% CAGR)
- Miss 10 best days: 765,574 (9.9% CAGR)
- Miss 30 best days: ₹23,939 (4.5% CAGR)
- Miss 50 best days: ₹11,188 (0.6% CAGR)
2. Nifty Midcap 150 TRI
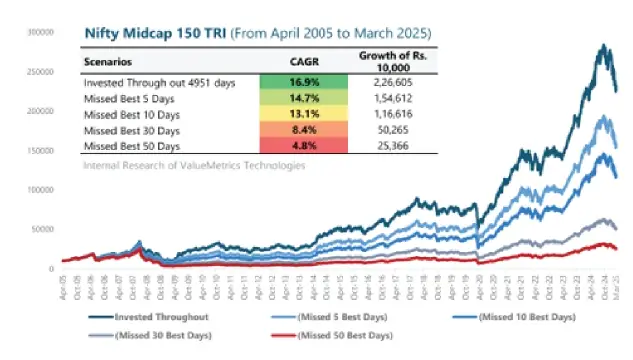
Next, the study analyzed the Nifty Midcap 150 TRI, which represents the performance of mid-sized companies-firms that are often more volatile but also offer higher long-term growth potential. 300000 Nifty Midcap 150 TRI (From April 2005 to Marc
Here’s how ₹10,000 would have grown in this index:
-
- Fully invested: 10,000 → 2,26,605 (16.9% CAGR
- Miss 5 best days: 1,54,612 (14.7% CAGR)
- Miss 10 best days: ₹1,16,616 (13.1% CAGR)
- Miss 30 best days: 50,265 (8.4% CAGR)
- Miss 50 best days: ₹25,366 (4.8% CAGR)
Because midcaps move sharply in both directions, missing even a handful of
strong recovery days can drastically reduce long-term returns.
3. Nifty Smallcap 250 TRI
Finally, the study looked at the Nifty Smallcap 250 TRI, which includes smaller companies that typically experience larger price swings—both up and down.
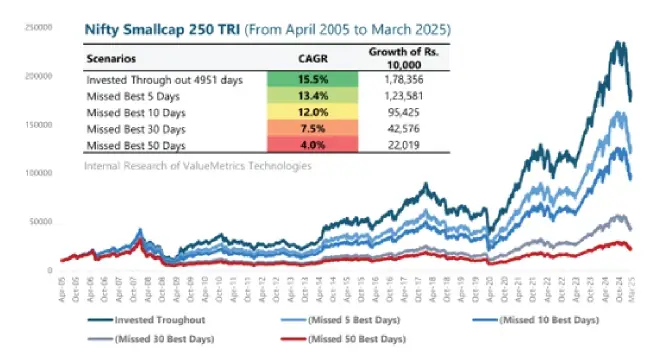
The findings were even more striking:
-
- Fully invested: 10,000 → 1,78,356 (15.5% CAGR)
- Miss 5 best days: ₹1,23,581 (13.4% CAGR)
- Miss 10 best days: 795,425 (12.0% CAGR)
- Miss 30 best days: ₹42,576 (7.5% CAGR)
- Miss 50 best days: ₹22,019 (4.0% CAGR)
In small caps, the biggest gains often come soon after the steepest declines. Investors who exit during volatility frequently miss these sharp rebounds-and the long-term wealth that follows.
The uncomfortable pattern
- The market’s long-term return is disproportionately delivered in a small set of outsized days. Missing just 10 of them over 20 years cut Nifty 50 outcomes from 1,38,688 to 65,574 on 10,000 more than halving the end result. That gap compounds into life goals not funded, retirements delayed, and opportunities forgone.
- Staying invested is not about blind optimism; it’s about acknowledging that the biggest positive days are unpredictable, clustered around fear, and impossible pick reliably in real time. Participation beats prediction.
What to do instead
1. Automate your discipline.
Continue your SIPs or systematic investments regardless of market noise. Automation removes the temptation to time the market.
2. Plan before the panic.
Decide in advance how you will invest during market corrections. Predefined rules prevent emotional decisions when volatility strikes.
3. Keep emergency funds separate.
Maintain adequate liquidity for short-term needs. This ensures you are not forced to sell long-term investments during temporary declines.
4. Focus on long-term progress.
Evaluate your portfolio over complete market cycles, not short periods. Market returns often come in bursts, and you must be invested to capture them.
A clear disclosure and full credit
This note summarizes “The Mirage of Perfect Market Timing,” produced by Value-Metrics Technologies using ACE MF, NSE, and internal research data as of March 13, 2025. Past performance may or may not be sustained in the future; index returns do not represent any specific scheme; figures shown are pre-tax and exclude duties/levies; and this is for understanding concepts, not a complete investment plan. Please consult your advisor for personalized decisions. All charts, tables, and core insights are credited to Value-Metrics Technologies Pvt. Ltd.
Conclusion
If you’ve ever felt the urge to “just wait for a better entry,” you’re not alone. The evidence shows that the market tends to reward those who show up and stay the course – especially on the uncomfortable days. Our job is to help you remain invested through those storms so you’re present for the sunshine that usually follows. Participation is the edge. Precision is the mirage.