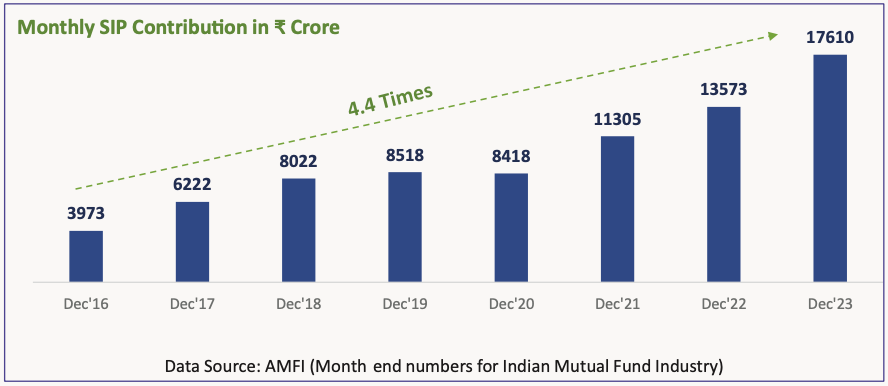
Over the years, the Systematic Investment Plan (SIP), a feature offered by Mutual Funds, has become a household name. Its popularity among investors can be seen from the graph given below, which depicts growth in monthly SIP contribution by investors over the last seven years.
This study aims to provide a holistic picture to our investors so that investors can make better-informed decisions for their investments. Any calculations shown in subsequent pages are approximations and are meant for understanding a particular concept. Past performance may or may not be sustained in future and is not a guarantee of any future returns. These calculations/views alone are not sufficient and should not be used for the development or implementation of an investment strategy. Investors should consult their financial advisers if in doubt about whether the product is suitable for them.
Happy Investing: -)
Q1. What is an Ideal Investment Time Horizon for SIP?
Experts often suggest investors invest for the “Long-term,” but what exactly is “Long-term”? What is the “Ideal Investment Horizon”? Or is there anything called an “Ideal Investment Horizon”?
Equities have proved to be a volatile asset class in the past. But, the study reveals volatility reduces as investors increase their investment horizon. (Data for S&P BSE Sensex TRI)
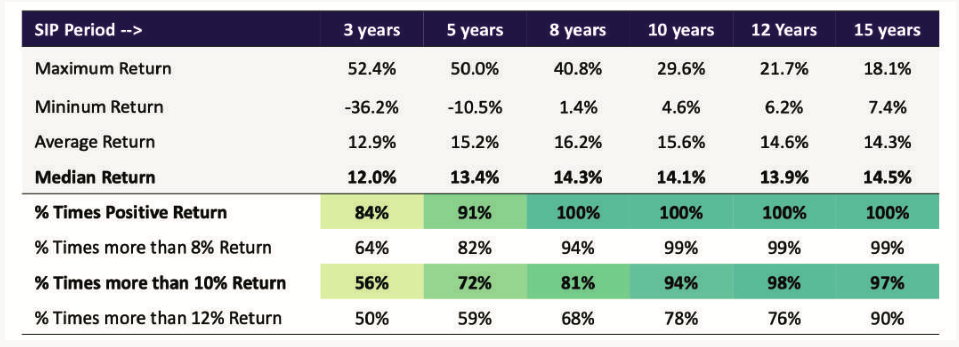
The above returns are %XIRR Rolling Returns on a monthly basis for S&P BSE Sensex TRI for SIP between September 1996 to December 2023.
Longer the Investment Horizon,
Higher is the Probability of receiving decent Returns!
Q2. Which is better, starting SIP at the Top or Bottom?
First, Let’s accept that it is impossible to consistently predict the exact Top or Bottom of a Market Cycle. At best, one can create and follow a valuation checklist whenever one deviates from their Strategic Asset Allocation, which should help investors reduce portfolio-level volatility to some extent while participating in the equity market.
But still, let’s assume one has some magical power, can predict the exact Top and Bottom, and wants to start a long- term SIP. So, should that investor start SIP at the Top of the cycle or the Bottom? We did a detailed analysis using long- period data of S&P BSE Sensex TRI (last 27+ years). We took all those periods when equity market has fallen more than 20% from its Top. The table below is the investment summary of two investors, one who started a Rs. 10,000 monthly SIP at the Top of various market cycles and the other at the Bottom:
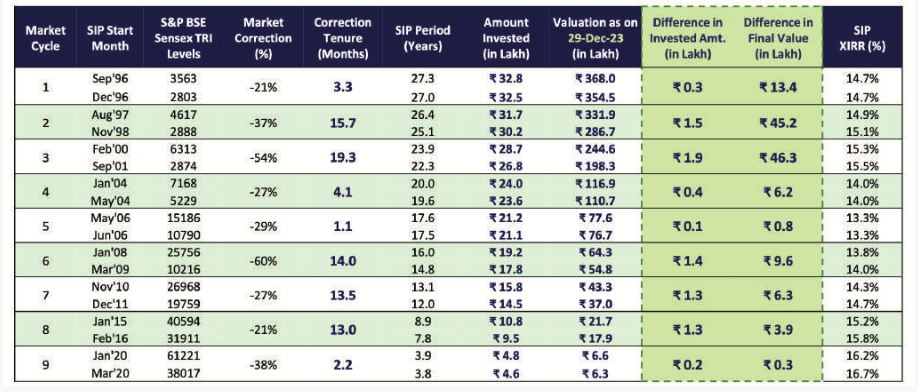
How to read the above table: For example, if someone would have started a monthly SIP of Rs. 10,000 in S&P BSE Sensex TRI during January 2008 (at the peak of market cycle six as per the above table), as of 29th December 2023, they would have invested Rs. 19.2 Lakh and the current value of this investment would have been Rs. 64.3 Lakh at an XIRR of 13.3%. Similarly, if somebody had started this SIP in March 2009 (at the bottom of market cycle six as per the above table), as of 29th December 2023, they would have invested Rs. 17.8 Lakh (Rs. 1.4 Lakh less than earlier investors) and the current value of this investment would have been Rs. 54.8 Lakh (Rs. 9.6 Lakh less than earlier investor) at an XIRR of 13.3%.
Some Findings:
1. It is interesting to note that while the % return is marginally higher for SIPs started at the bottom of the market cycle, the absolute gain in the rupee term (Wealth Creation) is far higher for SIPs that began at the top.
2. The “Cost of Delay” of starting SIP late can be huge over the long term. The longer the market takes to reach the bottom, the higher the “Cost of Delay,” keeping all other things constant.
3. Even the marginal difference of % return goes away over the long-term, irrespective of whether you started at the top or bottom (refer to the return difference for SIPs during the first 6 Market Cycles, i.e. in long-term).
The biggest risk is not the market,
but missing out on compounding over time.
Q3. Which Date to Select for Monthly SIP?
Start of the Month? End of the Month? Middle of the Month? Near the Last Thursday of the month because of higher volatility due to F&O expiry? Splitting SIP amount into multiple date SIPs?
We tried answering these commonly asked questions using long-period data from S&P BSE Sensex TRI (a widely tracked Indian Equity Market Index). The study of the last 27+ years’ index data reveals no meaningful difference between the average return of different dates’ 10-year SIPs.
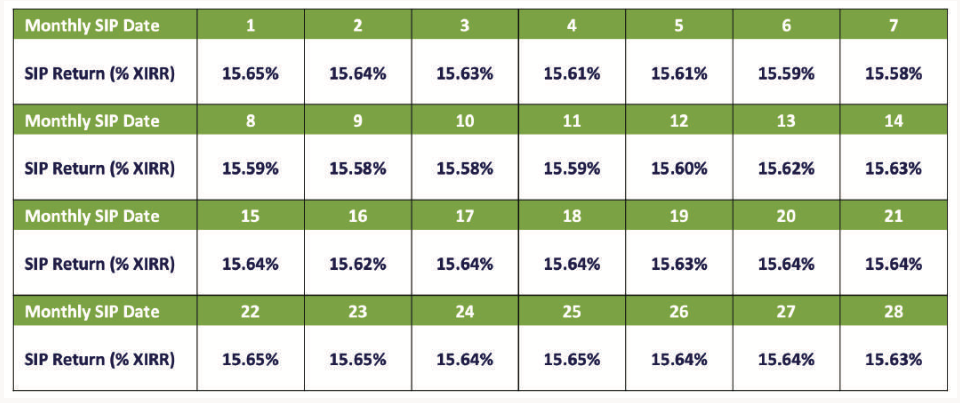 10 Years Average SIP Return (% XIRR) on Daily Rolling Basis for particular date of the month for S&P BSE Sensex TRI between September 1996 to December 2023.
The best SIP date in our view, is when an investor usually receives money in his/her bank account (For Eg. Salary Credit Day).
Q4. Shall I stop my SIP since the market is not doing well?
Data for S&P BSE Sensex TRI
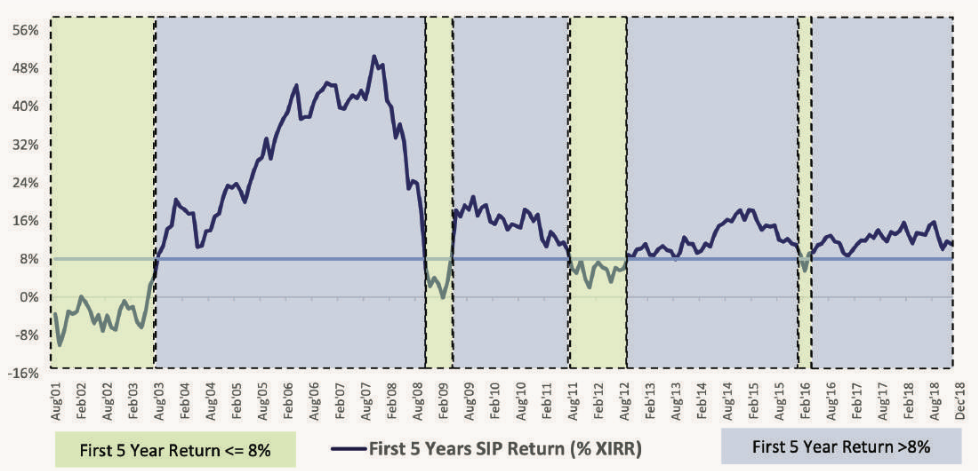
Equity as an Asset Class is relatively very volatile and, there can be periods of low returns in the initial investment journey of a long-term SIP.
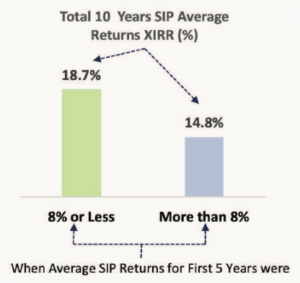
But historical data suggests that the SIP, which has delivered comparatively lower returns in the initial 5 years, has delivered a better return on 10 years basis (on an average).
Source: MFIE, 10 Years and 5 years Average SIP Return (% XIRR) on monthly basis at the end of month for S&P BSE Sensex TRI between August 1996 to December 2023.
A Slow Start is a Good Start !!