Risk vs. Reward: How the Sharpe Ratio Helps You Invest Wisely

When choosing mutual fund schemes, do you focus only on returns, or do you also consider risk-adjusted returns?

Let me walk you through a simple situation.

Imagine you need to travel tomorrow. The destination is 100 kilometres from your home. You have two drivers to choose from. One of them takes you there in 90 minutes. The other takes you there in 100 minutes. At first glance, most people would pick the first driver. He saves you time. Seems like the obvious choice.

But now consider this.

The first driver, who covered the distance in 90 minutes, was driving recklessly. He overtook dangerously five times. He kept accelerating and decelerating unpredictably. It felt unsafe. On the other hand, the second driver took just ten minutes more but drove smoothly. No risky overtakes. No abrupt speed changes. Just a calm, consistent journey. And remember, there was no urgency to reach quickly. You weren’t in a hurry.

Now, ask yourself again. Which driver would you choose?

Most of us would now choose the second one. Because peace of mind and safety matter more than saving a few minutes.

Now here comes the real question. Do you follow the same principle in your investments?

When selecting a fund, do you focus only on how much return it delivered? Or do you pause to ask what kind of risks were taken to get those returns?

The truth is, many investors look only at returns. They ignore how much volatility or risk came with them. That’s where the idea of risk-adjusted returns becomes crucial.

So, how can you assess them?

My colleague Mr. Omkarthik explains it clearly below through the concept of the Sharpe Ratio — a powerful tool that helps you evaluate how wisely your mutual fund is balancing reward with risk.

Imagine you have two investment options—Investment A and Investment B—both have expected annual returns of 15%. At first glance, they seem equally attractive, but there’s a catch: Investment A carries more risk than Investment B. Would you still choose A?

Now, consider another scenario: Investment A has an expected annual return of 16%, while Investment B has 15%. The difference seems small, but what if Investment A comes with significantly higher risk? Is that extra 1% return worth the added uncertainty?

Smart investors know that returns alone don’t tell the full story—risk matters too. If Investment B achieves the same return with less risk, it’s clearly the better choice. This is exactly where the Sharpe Ratio helps—by measuring how much return an investment generates relative to the risk taken, allowing us to make smarter, more balanced decisions. Let’s dive in and understand how it works!

What is the Sharpe Ratio?

The Sharpe Ratio evaluates an investment’s return compared to its risk. It does this by measuring the excess return over a risk-free asset, like government bonds. A higher ratio indicates better risk-adjusted performance. It helps investors determine if higher returns justify the added risk.

An easy way to understand this is by thinking about a road trip:

  1. Portfolio Return (Rp) – This is like the distance you travel. Just as you want to cover more ground, investors want higher returns.

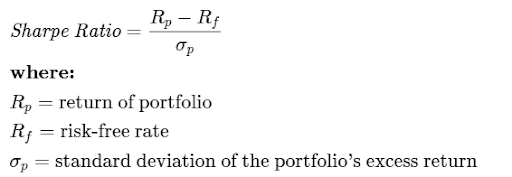
  2. Risk-Free Rate (Rf) – Think of this as the highway speed limit—a safe, predictable speed (like government bonds) that carries less risk.

  3. Standard deviation (σp) – Standard deviation shows how much an investment’s returns move up and down over time. A higher value means more unpredictability, while a lower one indicates stability. Imagine a road trip—smooth highways reflect low standard deviation (steady returns), while traffic and detours reflect high standard deviation (volatile returns).

Now, let’s understand how we can use standard deviation practically in investment analysis.

MetricNifty Smallcap
250 Index
Nifty 100 IndexWhat it means
3-Year Trailing
Returns
15.64%10.50%Smallcap index delivered
higher returns over the past
3 years.
3-Year Standard
Deviation (Risk)
20.22%14.02%Smallcap index was more
volatile (riskier)
Risk-Return
Trade-off
High Risk,
High Return
Lower Risk,
Lower Return
Matches the general
investing principle-more
risk can mean more reward.

Source: Investwell

Interpreting the Sharpe Ratio

Sharpe ratios above 1 are typically seen as favorable, indicating that the investment delivers excess returns relative to its risk. However, investors don’t just look at a single number—they compare a portfolio’s Sharpe ratio to similar funds or market benchmarks. For instance, a portfolio with a Sharpe ratio of 1 may seem unfavorable if competing investments in the same category have ratios above 1.2.

Below is the Sharpe ratio comparison for large-cap, mid-cap, and small-cap mutual, presented without mentioning specific fund houses name.

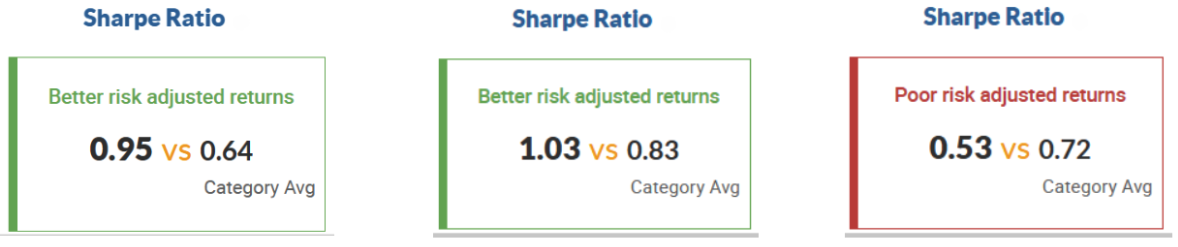
Ratios calculated on daily returns for last 3 years (Updated as on 30th April, 2025)

Limitations of the Sharpe Ratio

The Sharpe Ratio is useful for comparing investments, but it treats all risk the same, whether it's positive price swings or harmful losses. However, investors mainly worry about downside risk—sharp declines that hurt their portfolio. This is where the Sortino Ratio excels, as it focuses only on negative volatility. By measuring risk that actually impacts returns, the Sortino Ratio helps investors find investments that offer strong returns while minimising losses, making it a better choice for risk-conscious investors.

Source: Investopedia Moneycontrol

Leave a Reply

Your email address will not be published. Required fields are marked *