
When choosing mutual fund schemes, many investors focus only on returns without considering the risks taken to achieve them. It’s like picking a faster driver without noticing if they drove recklessly. Just as most people would prefer a safer, smoother driver even if the journey takes a bit longer, wise investors should look at risk-adjusted returns rather than just high returns. The Sharpe Ratio helps check if a fund’s returns are coming with the risk. However, the Sharpe Ratio has its limitation – it treats all market movements, including the upside, as risk. But investors don’t see upside market movements as risk; they welcome them. That’s where the Sortino Ratio comes in, as it focuses only on downside risk, making it more aligned with what investors truly want to avoid. ו
To understand how these ratios measure risk, it helps to first grasp what standard deviation means. Think of it as a measure of how much your fund’s returns “wander” from the average return — similar to how much a car’s speed varies during a journey. If the car mostly cruises at a steady, safe pace (like consistent returns), the standard deviation is low. But if the car’s speed keeps changing – sometimes too slow, sometimes too fast – the standard deviation is high, signaling a bumpier, less predictable ride. In investing, a higher standard deviation means your returns are more volatile, moving further away from the average – and that’s what risk-adjusted ratios like Sharpe and Sortino help to evaluate.
Imagine you’re driving on a smooth highway. Sometimes, the car picks up a little extra speed on an empty stretch — you’re still in control, the road is clear, and you reach your destination faster without any danger. This is similar to upside movements in the market (light shaded area) — they help you get closer to your financial goals more quickly, and there’s no reason to worry about them. But now,
picture moments when you suddenly brake, avoid obstacles, or hit potholes – these are the stressful and risky parts of the journey. In investing, this represents downside movements in the market (dark shaded area)- the part that can actually cause damage and that investors want to avoid.
This is where understanding how risk is measured becomes important. The Sharpe Ratio treats both the smooth speed boosts (upside) and the scary moments (downside) as risk because it looks at all deviations from the average. But as an investor, you’re really only concerned about what could hurt your journey. That’s why the Sortino Ratio is more meaningful – it focuses only on the dangerous parts, the downside movements or downside deviation, just like you’d want a driving measure that only warns you about what could actually make the ride unsafe.
What is the Sortino Ratio?
The Sortino ratio penalizes managers only for “harmful” downside deviation and is a measure of return per unit of downside risk, whereas Sharpe ratio measure of return per unit of standard deviation(both upside and downside).
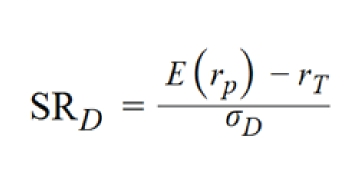
E(rp) = Expected Return of portfolio
rT = Risk Free return or minimum acceptable return (MAR)
oD = Downside deviation
Source: CFA® Program Curriculum2025 – LEVEL III CORE – VOLUME 3 p.53
The 13 lakh lesson: why sortino beats sharpe
The table below compares two portfolios – Portfolio A and Portfolio B- with identical returns for 9 out of 10 years but very different volatility in one year. It helps explain how Sharpe and Sortino Ratios treat risk differently – and why the Sortino Ratio gives a clearer picture of real downside risk.
| Year | Return | |
|---|---|---|
| A | B | |
| 1 | -3% | -3% |
| 2 | 4% | 4% |
| 3 | 30% | 30% |
| 4 | 5% | 5% |
| 5 | 13% | 13% |
| 6 | 16% | 16% |
| Year | Value of Ten Lakhs | |
|---|---|---|
| A | B | |
| 10,00,000 | 10,00,000 | |
| 1 | 9,69,869 | 9,69,869 |
| 2 | 10,12,493 | 10,12,493 |
| 3 | 13,18,936 | 13,18,936 |
| 4 | 13,80,111 | 13,80,111 |
| 5 | 15,66,102 | 15,66,102 |
| 6 | 18,18,861 | 18,18,861 |
| Year | Return | |
|---|---|---|
| A | B | |
| 7 | -26% | 26% |
| 8 | 6% | 6% |
| 9 | 21% | 21% |
| 10 | 10% | 10% |
| Year | Value of Ten Lakhs | |
|---|---|---|
| A | B | |
| 7 | 13,53,396 | 22,84,327 |
| 8 | 14,30,423 | 24,14,337 |
| 9 | 17,35,106 | 29,28,595 |
| 10 | 19,10,162 | 32,24,064 |
| Metric | Type | Value |
|---|---|---|
| Sortino Ratio | A | 0.07 |
| B | 2.19 | |
| Sharpe Ratio | A | 0.05 |
| B | 0.61 |
As seen in the above example, suppose, in the 7th year, Portfolio A crashed -26%, while Portfolio B soared +26%. Result: 10 lakhs became 19 lakhs in Portfolio A versus 32 lakhs in Portfolio B. A 13 lakh difference from one bad year.
As an investor, don’t look only at whether your fund has gone up from last year. Also think about what you might be missing by not being in a better-performing fund. Try to choose funds that give steady and consistent returns over time.
Sortino Ratio’s Advantage: It penalizes only downside risk (losses), ignoring upside volatility. Portfolio A scored 0.07 while Portfolio B is much higher at 2.19—a clear gap that reveals Portfolio A suffered significant losses, signaling you to avoid it. Portfolio B’s strong Sortino ratio shows it delivered returns with minimal downside risk.
Sharpe Ratio’s Problem: It treats all volatility—good gains and bad losses—the same way, both counted as “risk.” In above data, Portfolio A scored 0.05 and Portfolio B scored 0.61- difference is not wide as Sortino ratio above. The Sharpe ratio thus masks the true magnitude of downside risk present in Portfolio А.
Interpretation of sortino ratio
Conclusion
Your Safety Net Against Market Downturns
The Sortino ratio reveals what investors truly care about: how much protection they get from their fund manager when markets turn ugly. By shifting focus from total volatility to downside risk alone, this metric cuts through the noise and shows you funds that are genuinely designed to protect your money. Next time you compare mutual funds, check their Sortino ratio first—it’s the most honest conversation between you and your fund manager’s risk management skills.


